 Peter Founder
ProPush Case Study: $3 a Day on Facebook to 79% ROI in 3 Months
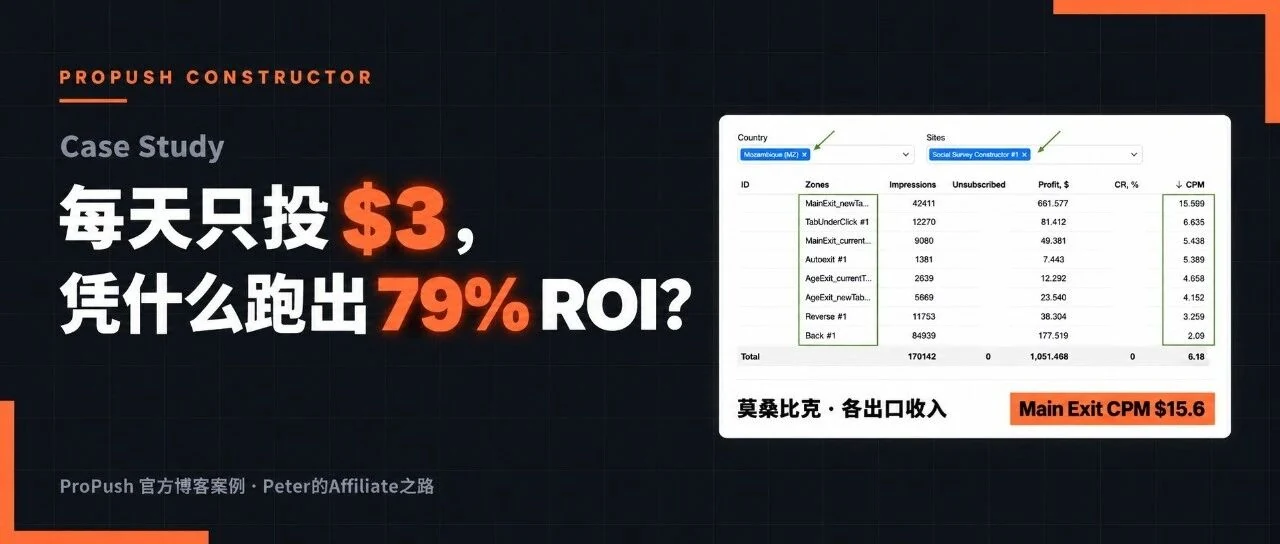
Case Breakdown · Issue 5
Hi, I’m Peter.
This issue’s case comes from the official ProPush blog: a publisher bought traffic on Facebook, used the Social Survey template from ProPush Constructor as the landing page, spent $883 over three months and got $1,581 back.
It’s not a big operation, which makes it a good reference for community members who are just starting out on a small budget.
| Ad spend | ProPush revenue | Profit | ROI |
|---|---|---|---|
| $883 | $1,581 | $698 | 79% |
Campaign setup
| Metric | Value |
|---|---|
| Traffic source | Facebook Ads |
| Monetization | Constructor · Social Survey |
| Payout model | RevShare |
| Main GEOs | Mozambique, Rwanda |
| Devices | Android + iOS |
| Period | About 3 months |
| Average CPM | $6.087 |
| Best month | June, $818.62 |
Data provided by the publisher, published on the official ProPush blog on September 9, 2026.
01 Why Facebook + Social Survey
He chose Facebook for one reason: fast feedback.
Audiences and creatives can be swapped and tested quickly; once a combination that works comes out, it can be scaled right away.
The other layer is the user’s state of mind.
People scrolling Facebook are scrolling with curiosity. An image hooks them, and they click through to see what it is.
Social Survey then asks a few light questions — age, gender, relationship status — and the curious answer them without a second thought.
Those questions, in turn, told him which direction the creatives should go.
02 Targeting and the baseline
Mainly Mozambique and Rwanda.
He tested other GEOs too, but these two consistently delivered the bulk of the traffic and revenue, so the budget stayed there.
This is his Mozambique data from the back end, broken down by exit:
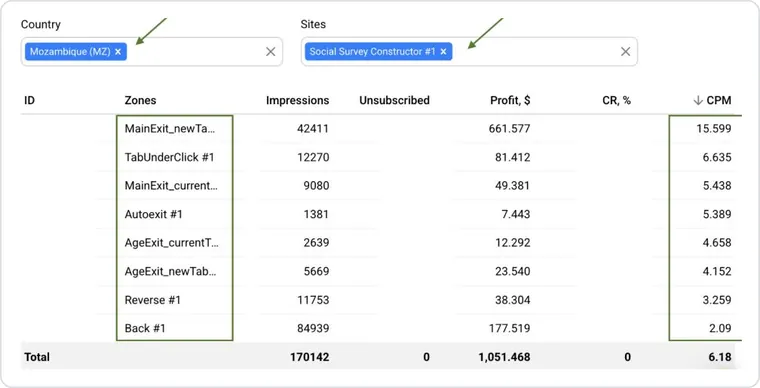
Mozambique · Social Survey by exit
This table totals $1,051 at a $6.18 CPM, the larger of the two countries.
Android and iOS ran together, and CPM sat around $6 for the whole period.
That $6 is the starting point for all of his decisions.
The rule of RevShare is simple: the flow has to earn more than the traffic costs.
Before launching, he worked backwards from $6 to the most he could pay per result. The CPR thresholds mentioned later all come from this.
03 How the creatives are made
He used non-explicit creatives with women as the main subject, inspired by the content people already like to engage with on Facebook and Pinterest.
The goal is just one: spark curiosity and get the click.
He specifically pointed out that traffic quality directly affects the cost per result, so creatives aren’t just about CTR.
He gave a few rules.
Target men aged 25 to 45. He marked this as very important; in testing, this range was clearly better.
One creative, one point. Keep the image simple; no multi-layered compositions that take ages to read.
Leave suspense, don’t explain. Making people want to know what they’ll see after clicking is enough.
Don’t get lazy with the primary text and headline. Most users read what the ad says before deciding whether to click.
In his best campaigns, the cost per landing page view got down to around ₦5, about $0.003.
That number swings a lot by GEO, audience and creative; it’s not the norm.
Below are two creatives he provided:

Creatives provided by the publisher
04 Starting the test: $3 a day
He starts a new campaign at $3 a day.
Meta’s learning phase usually takes 2 to 3 days. On the network side, average eCPM is only about $6, so CPR has to be pushed very low for there to be any profit.
If a new ad set spends too much right out of the gate, you don’t yet know whether the combination works, and traffic costs have already gone up.
So the $3 isn’t testing whether it can make money; it’s keeping spend under control in the first few days.
Meanwhile he checks whether the GEO responds, whether the creatives spark curiosity, whether landing page traffic is cheap, whether Constructor has started producing revenue, which ad set has the most potential, and, while at it, whether there’s anything wrong with the settings and tracking.
Whether it can make money has to wait until enough data has accumulated.
05 What to look at in the first 8 to 12 hours
After building a campaign, he leaves it alone for half a day and comes back after 8 to 12 hours.
A few things to check in each of the two back ends:
| Ads Manager | ProPush back end |
|---|---|
| CTR | Whether impressions are coming in |
| Landing page views | Whether revenue has started to appear |
| Initial CPM |
A new ad set’s CPR is always on the high side in the first few hours, so at this point he ignores CPR and looks only at CTR.
Ads with a CTR above 18% are left untouched for the next 48 hours, no exceptions.
That gives Meta time to optimize and keeps promising ads from being shut off too early.
06 One ad set at a time
Each campaign gets only one ad set. Watch it for 8 to 12 hours, or the full 24 hours if data is thin.
Obvious losers get stopped outright. Good ones run another 2 to 3 days with nothing changed, waiting for them to finish the learning phase.
This is the step where many people can’t resist. Edit a running ad set and it will very likely get kicked back into the learning phase, and the stability you paid for is wasted.
There’s one more number that directly determines how much test budget you should set aside:
He usually has to test 3 to 5 ad sets to find one worth scaling.
So don’t budget for a single launch; budget for around four rounds.
07 When to scale, and how
He only makes a scaling decision once an ad set has spent $15 to $20; by then you can see clearly whether CPR is stable.
The green light for scaling is a CPR around $0.00323, which is ₦5 or lower in his reports.
Once it hits that line, he raises the ad set budget by 20% to 30%, watching CPR as he goes.
As for direction: horizontal means duplicating an ad set that’s already working; vertical means adding budget with a bid cap. He accepts both and uses horizontal more often himself.
Duplicating a running ad set within the same campaign doesn’t disrupt the original’s CPR. When duplicating, he tests new creatives at the same time.
A winning ad set gets duplicated at most twice.
Any more and the ad sets start competing for the same people, and performance slides back.
Strung together, the whole process is a loop:
- Test: $3 a day, one ad set, one GEO
- Check: after 8 to 12 hours, look at CTR, landing page views and initial CPM
- Pick the winner: CPR at $0.00323 (about ₦5) or lower, decide once $15–20 is spent
- Duplicate: duplicate within the same campaign with new creatives, at most 2 times
- Scale: raise the ad set budget 20–30%, watching CPR as you go
Horizontal only: the original ad set keeps running at its own CPR, untouched.
08 Have the next creative ready
On Facebook, a creative that’s running well can get rejected or become unusable overnight, regardless of performance.
His answer is to always have the next one ready: make a new one or a revised version within the platform’s ad policies, so the traffic never stops.
Read through Meta’s Advertising Standards before making creatives, not after a rejection.
Optimization doesn’t follow a fixed rhythm either. Whichever ad set outperforms the others becomes the base for the next round of testing; weak creatives are pulled before they eat the budget. Then another round.
09 Results
Over about three months, ProPush revenue came to $1,581.81 at an average CPM of $6.087.
June alone was $818.62 at a $6.988 CPM, above the period average. Both volume and the value of the traffic were climbing.
Here is the day-by-day breakdown for June that he provided; the last row is the monthly total:
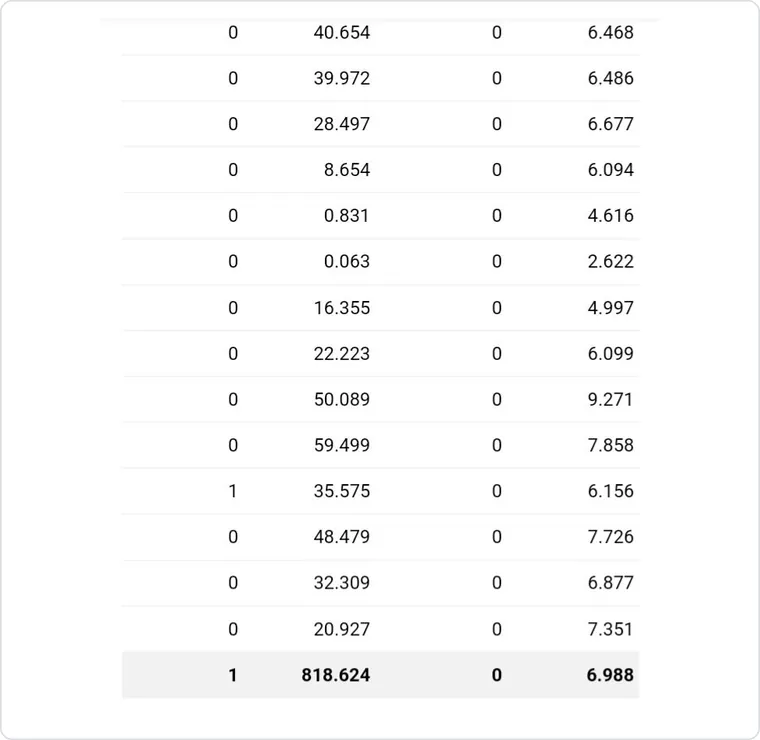
June total $818.62, CPM $6.988
Spent $883, took in $1,581, earned $698, ROI 79%.
More than half the revenue came in June, when the whole setup had been tuned to its best state.
10 Five takeaways
- Start small: there's no need to invest heavily before you know whether a campaign has potential. A small budget is enough to gather data without taking on extra risk.
- GEOs differ a lot: Mozambique and Rwanda were the strongest in this batch of campaigns, but that came from testing, not guessing. Test several countries.
- Creatives are key: however good the offer, if the creative doesn't spark curiosity or get clicks, there won't be enough traffic. Test several angles to find better combinations.
- Don't rush to scale: looking good on a small budget doesn't mean you can scale hard. Gather enough data, pick the strong ad sets, then increase step by step.
- A working combination is the start of the next round: a good ad set isn't just left running; he duplicates it to find better-fitting audiences.
11 Extra notes
Look at CPM by GEO and by monetization zone too, not just the total.
June CPM was $6.988 against a $6.087 average; that gap is enough to throw off your CPR target. Whichever GEO you scale, use that GEO’s numbers as the baseline.
Constructor monetizes in several zones, corresponding to different stages of user engagement. Main Exit has the highest engagement and usually the highest CPM; the other zones being lower is normal.
So look at the breakdown by exit: where users drop off, which path is worth the most, and whether any exit clearly outperforms.
The Rwanda table:
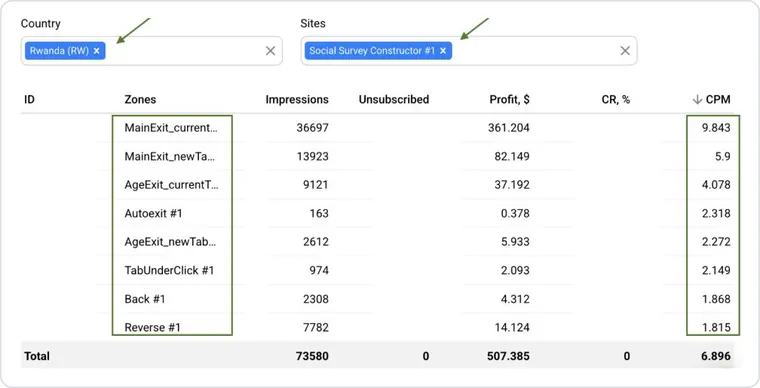
Rwanda · Social Survey by exit
Put the two tables side by side and the difference is pretty obvious.
In Mozambique the most impressions went to Back, 85,000, at a CPM of only $2.09; Main Exit had less than half the impressions at a $15.6 CPM, and that one exit took 63% of the table’s revenue.
In Rwanda the two Main Exits together account for 87%.
The money is concentrated in Main Exit, and you can’t see that from the total CPM alone.
If a template performs poorly, don’t rush to swap it. Constructor templates can be edited; sometimes changing a few lines of copy saves it.
ProPush’s AI assistant can change copy, images, colors and CTAs right in the chat box, adapt them by GEO and produce several versions at once to test, no code required.
12 My take
What’s worth taking away here is the order. First work backwards from a baseline like $6 to your own CPR threshold, then test on a small budget, give it enough time, and scale once the numbers hold.
Also, his reports are in naira while ProPush is in dollars. When you do this yourself, align the currency and the definitions on both the spend and revenue sides first.
If you have Facebook traffic and want to try this, open Constructor in the ProPush back end, pick a template that fits your traffic, tweak it, and start testing at a few dollars a day.
Income and ROI figures here are past results of one person or case, not typical outcomes. Paid traffic can lose money; start with a small test budget.
New articles and quick notes from Peter.